Toledo Bend Reservoir water level today
On Oct 28, 2026, Toledo Bend Reservoir is at 167.73 ft, 84.3% full (4.27 ft below full pool). That is 2.9 points above normal for this date.
Source: Texas Water Development Board · storage 1,885,978 of 2,236,450 acre-ft · provisional data
Toledo Bend Reservoir percent full history
Percent full Normal range (10th–90th percentile, 1996–2025) Average
Toledo Bend Reservoir from space
The same area near the lowest and the highest level since 2016, on clear days. Compare the shoreline and the coves.
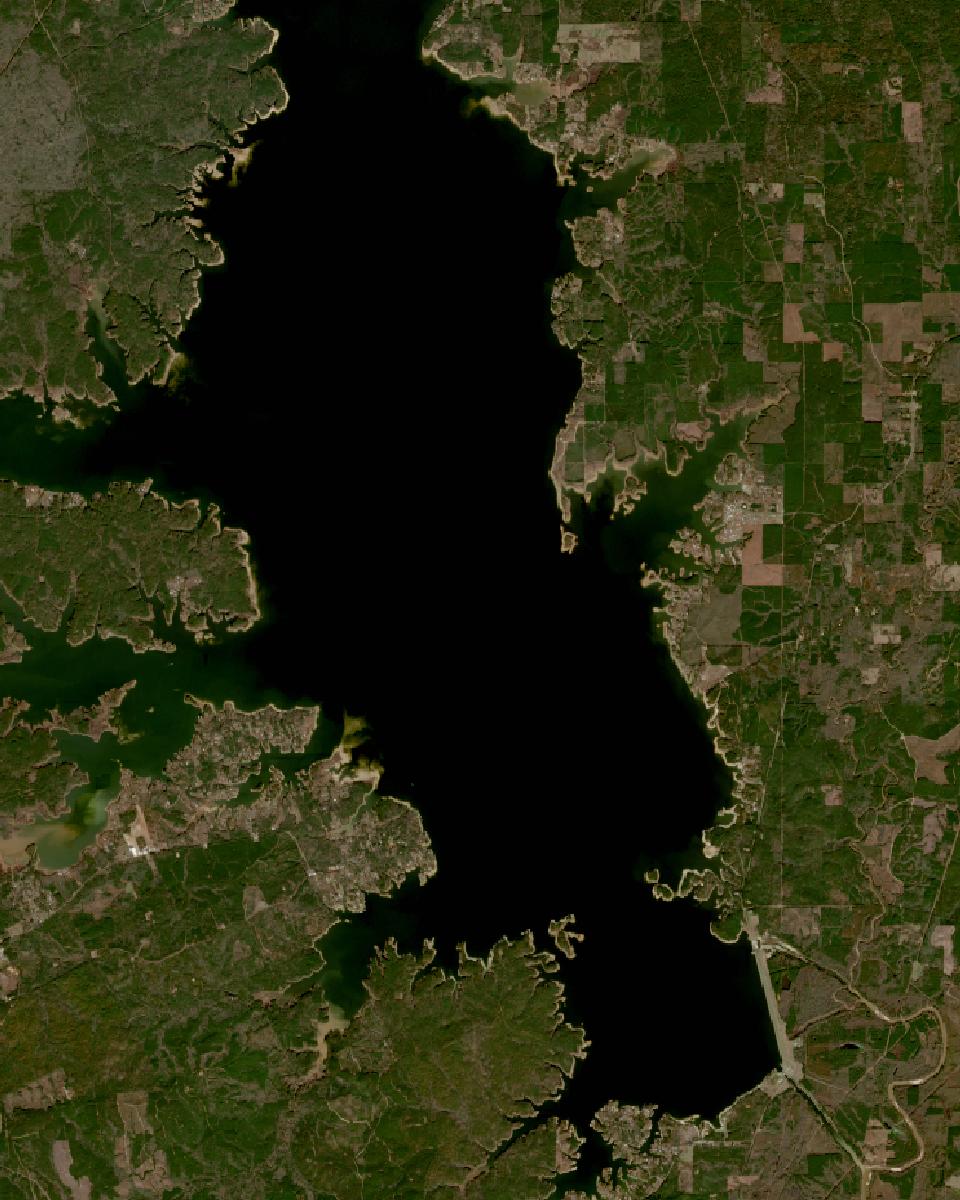
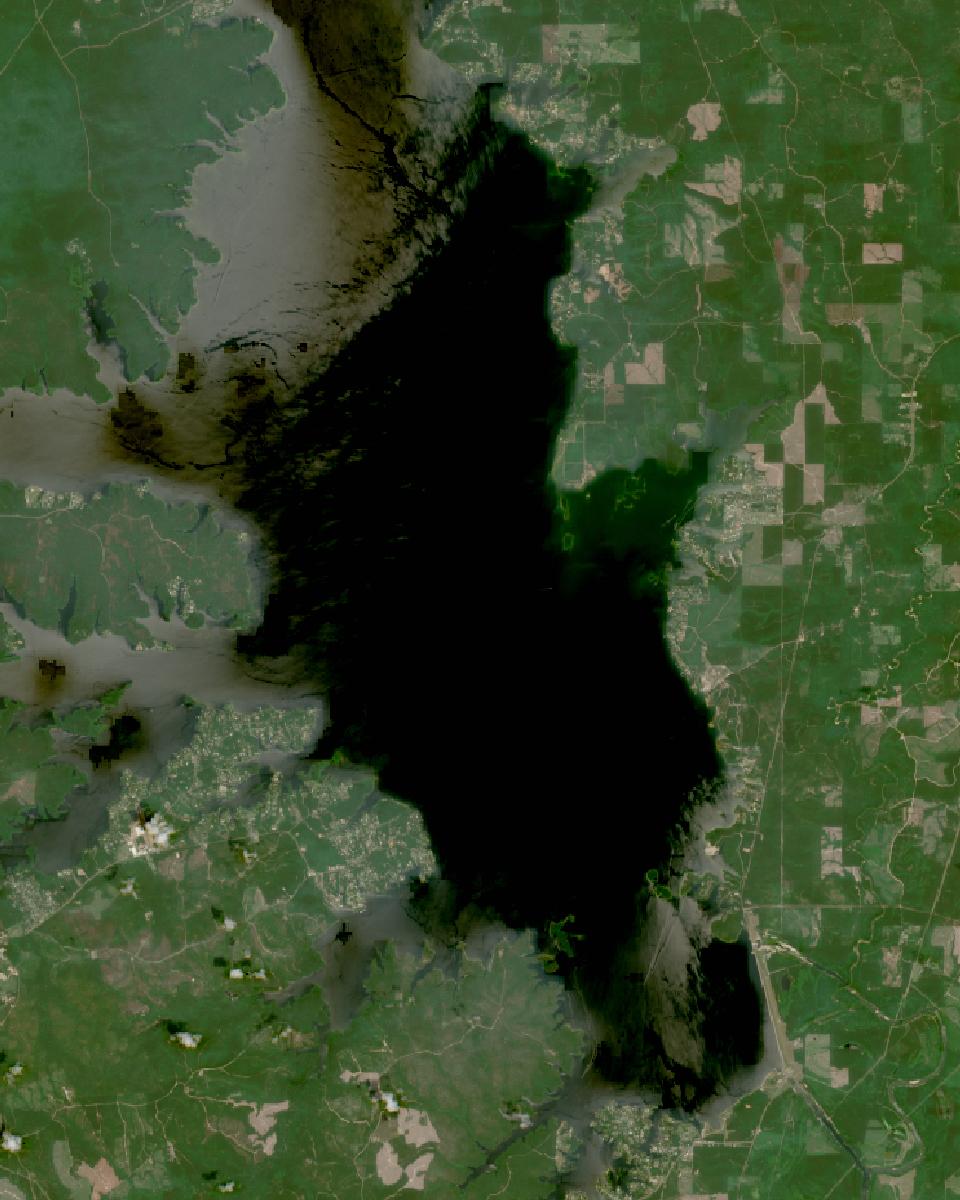
Imagery: NASA GIBS, Harmonized Landsat Sentinel-2 (HLS). Landsat 8/9 courtesy of NASA/USGS; contains modified Copernicus Sentinel data 2019, 2022. Black specks are cloud and shadow masks.
Records and key dates
- Record high
- 100.0%Mar 1, 1987
- Record low
- 57.6%Nov 19, 2011
- 12-month high
- 96.1%Jun 23, 2026
- 12-month low
- 83.2%Nov 11, 2025
- Last time full
- May 18, 2025
- Change in 1 year
- −0.06 ft−0.2 pts
About Toledo Bend Reservoir
- River basin
- Sabine
- Full pool (top of conservation pool)
- 172.00 ft
- Conservation capacity
- 2,236,450 acre-ft
- Surface area today
- 162,231 acres
- Dead pool elevation
- 100.00 ft
- Flood control reservoir
- No
- Data since
- Oct 2, 1986
Monthly average, last 10 years
Average percent full each month.
| Year | Jan | Feb | Mar | Apr | May | Jun | Jul | Aug | Sep | Oct | Nov | Dec |
|---|---|---|---|---|---|---|---|---|---|---|---|---|
| 2026 | 85% | 85% | 87% | 89% | 91% | 94% | 94% | 90% | 87% | 85% | — | — |
| 2025 | 90% | 94% | 96% | 98% | 99% | 99% | 96% | 92% | 87% | 85% | 84% | 85% |
| 2024 | 88% | 97% | 92% | 98% | 100% | 100% | 96% | 90% | 86% | 84% | 84% | 87% |
| 2023 | 90% | 97% | 92% | 96% | 99% | 98% | 94% | 90% | 86% | 85% | 84% | 84% |
| 2022 | 87% | 89% | 92% | 95% | 98% | 95% | 89% | 85% | 85% | 83% | 84% | 86% |
| 2021 | 90% | 89% | 92% | 96% | 100% | 100% | 96% | 91% | 86% | 85% | 84% | 85% |
| 2020 | 79% | 89% | 99% | 100% | 100% | 97% | 96% | 91% | 89% | 86% | 85% | 86% |
| 2019 | 100% | 98% | 96% | 93% | 99% | 98% | 93% | 79% | 75% | 74% | 75% | 75% |
| 2018 | 85% | 91% | 100% | 99% | 94% | 91% | 90% | 87% | 86% | 86% | 91% | 98% |
| 2017 | 88% | 90% | 91% | 93% | 98% | 100% | 99% | 98% | 96% | 85% | 84% | 83% |
Frequently asked questions
Is Toledo Bend Reservoir full?
Not quite. On Oct 28, 2026 Toledo Bend Reservoir was 84.3% full, 4.27 feet below its full pool elevation of 172.00 ft. It was last full on May 18, 2025.
What is the normal level of Toledo Bend Reservoir for this time of year?
Between 1996 and 2025, Toledo Bend Reservoir averaged 81.4% full around Oct 28, and 8 in 10 years it was between 71.0% and 87.3%. Today it is +2.9 percentage points above that average.
What is the lowest Toledo Bend Reservoir has been?
In the TWDB record, which starts in 1986, the lowest daily value was 57.6% on Nov 19, 2011. The highest was 100.0% on Mar 1, 1987.
How often is the Toledo Bend Reservoir water level updated?
TWDB publishes one reading per day for each reservoir. We check for new data every 2 hours and show the date of the reading next to the level. Recent values are provisional.
What does percent full mean?
It is the water stored in the conservation pool divided by the conservation capacity (2,236,450 acre-feet for Toledo Bend Reservoir). Water above the conservation pool is flood storage and is not counted, so a reservoir can show 100% while rising into its flood pool.